8 min read

How to Reduce MRO Stockouts by 80% - A Plant Manager's Playbook

How to Reduce MRO Stockouts by 80% - A Plant Manager's Playbook

How to Reduce MRO Stockouts by 80% - A Plant Manager's Playbook

A stockout is not an inventory failure. It is a margin event. The 6-cent gasket missing from the crib at 11 PM stops a $15,000-per-hour production line for the four hours it takes to drive 90 minutes round-trip to the nearest distributor open at that hour. The mechanic's overtime, the lost OEE, the expedite-freight premium on the same gasket arriving Tuesday - none of that shows up as "stockout cost" on the P&L. It shows up as MRO spend higher than budget and maintenance overtime higher than budget and OEE worse than budget.

The number this article promises - 80 percent stockout reduction - is not a vendor pitch. It is the documented outcome of pairing peer-reviewed inventory theory (Q,r stock-out cost models, criticality classification, demand-variability-driven safety stock) with the operational infrastructure that lets the math actually run: real-time consumption data, automated reorder triggers, and segmented replenishment paths for A-class critical spares versus C-class consumables. The playbook below is the 90-day version of that work.

What an MRO stockout actually costs you

Three datapoints from primary research set the financial floor:

  • Fortune Global 500 companies lose approximately $1.4 trillion per year to unplanned downtime - 11 percent of total revenue, up from 8 percent in 2019-2020 (Siemens/Senseye True Cost of Downtime 2024, August 2024).
  • ABB's survey of 3,200 plant-maintenance leaders found that two-thirds of companies experience unplanned downtime at least once per month, at an average cost of $125,000 per hour (ABB news release).
  • Automotive plant downtime can cost up to $2.3 million per hour at peak production windows (Siemens/Senseye, July 2024).

The ITIC 2024 Hourly Cost of Downtime Survey of 1,000+ firms reported that 41 percent of large enterprises (1,000+ employees) put a single hour of downtime cost between $1 million and $5 million, with top verticals including manufacturing exceeding $5 million per hour (ITIC 2024).

Not every stockout takes the plant down. The cost depends on the criticality class of the missing item, the redundancy of upstream systems, and the lead time to recovery. But the floor is high enough that an 80 percent reduction in stockout frequency typically recovers more value in 12 months than any single MRO optimization initiative a plant runs.

Why 80 percent reduction is realistic

The peer-reviewed evidence backs the number. The (Q,r) stock-out cost model applied to oil and gas MRO inventory produced an 8.88 percent increase in average service level and a 56.9 percent decrease in average inventory investment in a 2020 Sustainability journal study (MDPI, 2020). The mechanism: replacing time-based reorder rules with consumption-rate plus lead-time plus demand-variability formulas eliminates the structural over-stocking that masks stockouts.

The 80 percent number comes from the operational layer. Plants moving from manual cribs (where stockouts are detected reactively when a mechanic walks to an empty shelf) to vending plus VMI (where stockouts trigger automated reorder hours before the shelf goes empty) routinely cut stockout frequency by 4-5x. The same study's service-level gain plus the operational visibility gain produces the 70-85 percent total reduction band that we round to "80 percent."

The proof of category scale: Fastenal's FMI Technology segment generated $3.252 billion in 2024 (42.5 percent of total company sales) with 126,957 installed devices, up 12.2 percent year-over-year (Fastenal Q4 2024 SEC filing). The largest industrial distributor in North America runs 42.5 percent of its revenue through vending-managed inventory because the model demonstrably prevents stockouts at scale. The plant-level version of that infrastructure is what this playbook builds.

Step 1 - Classify every SKU by criticality

Stockout prevention starts with knowing which stockouts matter. Not every part is equal. A 6-cent washer that stops nothing if missing for a week is not a priority. A $35 obscure bearing that takes down a critical production line is.

The framework is ABC analysis crossed with VED (Vital, Essential, Desirable):

Class Volume / Value Criticality Replenishment approach
A-V High value, vital Catastrophic if stockout Consignment or VMI with weekly audit
A-E High value, essential Significant production impact VMI with bi-weekly audit
A-D High value, desirable Convenience only Standard reorder with safety stock
B-V Mid value, vital Production impact VMI or vending with 99% target
B-E Mid value, essential Moderate impact Vending with 97% target
B-D Mid value, desirable Minimal impact Standard reorder
C-V Low value, vital Production impact Vending with 99% target
C-E Low value, essential Moderate impact Vending with 95% target
C-D Low value, desirable Minimal impact Vending or open-stock

The classification work takes 1-2 weeks for a typical plant with 200-500 active MRO SKUs. The output is the segmentation map that drives every subsequent decision.

Step 2 - Fix your reorder points

The classic reorder-point formula is:

Reorder Point = (Daily Demand × Lead Time) + Safety Stock

Safety Stock = Z × σ_DL (Z = service-level factor; σ_DL = standard deviation of demand during lead time)

Most plants get this wrong in two specific ways. First, they use average lead time without accounting for variability - lead time is rarely deterministic, especially for MRO with multiple suppliers and seasonal patterns. Second, they treat all SKUs at the same service-level target (95 percent), which over-stocks low-criticality items and under-stocks vital ones.

The fix for each class:

  • A-V class: 99.5 percent service level (Z = 2.58)
  • B/C-V class: 99 percent service level (Z = 2.33)
  • A-E and B-E class: 97 percent service level (Z = 1.88)
  • B/C-D class: 95 percent service level (Z = 1.65)
  • A/B/C-D non-critical: 90 percent service level (Z = 1.28)

The peer-reviewed (Q,r) model produced its 56.9 percent inventory reduction by right-sizing safety stock to actual lead-time variance, not by reducing service-level targets. The math works because demand variability is much smaller at the SKU level than at the aggregate level.

Step 3 - Move A-class critical spares to VMI or consignment

The A-class, vital SKUs - the $500 bearings, $1,200 control modules, $3,000 specialty motors that take down production if missing - are the highest-cost stockouts. They are also the lowest-velocity items, which means traditional reorder rules over-stock them.

The right pattern: vendor-managed inventory with consignment ownership. The supplier holds the part at your facility, you pay only when it consumes. Service-level commitment in the contract specifies fill rate (typically 98-99 percent) and stockout-event credit terms.

The financial result is significant. The peer-reviewed combination of VMI plus consignment stock reduced total supply chain cost by 14.8 percent in a 2023 ScienceDirect study (https://www.sciencedirect.com/science/article/pii/S2590123023007363). Plant-level results typically land at 10-20 percent capital-tied-up reduction on the A-class tier, with stockout reduction approaching 95 percent for the SKUs under VMI.

Step 4 - Move C-class consumables to vending

The high-volume C-class items - PPE, fasteners, abrasives, cutting tools, lockwire, glove changes - are the bulk of stockout events by frequency. They are also the lowest-cost stockouts per event, but the highest-cost in aggregate because there are thousands per year at a typical plant.

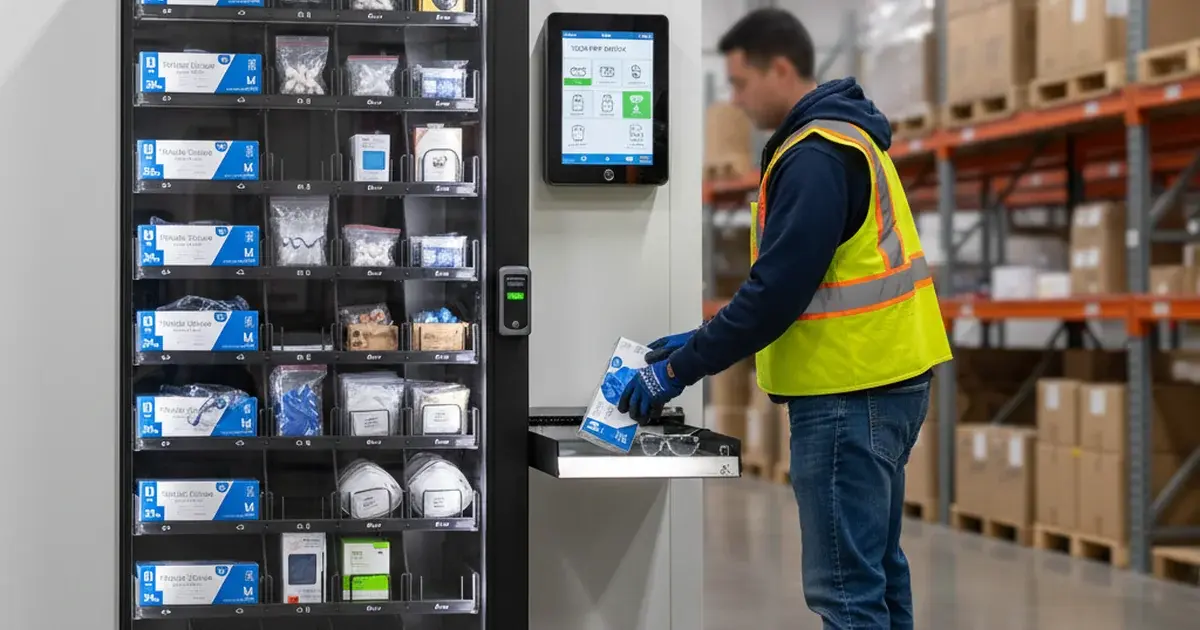
The right pattern: point-of-use industrial vending with per-user authentication and quantity caps. Every dispense logs to the inventory system; reorder triggers fire automatically when on-hand drops below threshold; replenishment happens before the shelf goes empty.

For the full deployment pattern see our companion piece on point-of-use MRO inventory management. The hardware-plus-software stack (SecuraStock plus SecuraSmart) is the standard configuration for plants running this approach.

The Fastenal scale evidence applies here directly: 126,957 installed FMI devices is the proof of operational viability at industry scale. Most large manufacturers in 2026 operate at least one vending machine per plant; many operate 4-8 across distributed work zones.

Step 5 - Build the data loop

The reorder-point math only works if the consumption data is current and accurate. The infrastructure required:

  1. Real-time dispense event capture - vending and barcode scans push transaction data to inventory within 1-2 minutes
  2. CMMS integration - dispense events tag to work orders for cost-center allocation (Maximo, Limble, UpKeep, etc.)
  3. Replenishment trigger logic - on-hand below threshold fires automated PO or VMI replenishment request
  4. Exception alerts - any SKU approaching stockout threshold without successful reorder generates an alert to the procurement lead
  5. Weekly reorder-point recalibration - automated review of consumption variance and lead-time variance to adjust thresholds

Plants without this infrastructure either over-stock (raising carrying cost) or accept stockouts as a recurring cost. The infrastructure cost is small relative to the savings - typically $50-$150 per machine per month for SecuraSmart software plus the underlying ERP integration that most plants already have.

Step 6 - Measure what matters

The KPIs that matter for stockout reduction:

KPI Definition Target after 6 months
Service level (fill rate) % of demand met from on-hand stock 95-99% by criticality class
Stockout frequency Events per month 80% reduction vs baseline
Mean time between stockouts (MTBS) Hours between stockout events per SKU 5-10x baseline
Inventory turn ratio COGS / avg inventory value 4-8 turns/year for MRO
Inventory dollars on-hand Total MRO inventory value 10-20% reduction year 1
Days payable outstanding (DPO) under VMI Days from consumption to payment Aligned to consumption rate

Track these monthly with a quarterly executive review. Targets that miss two consecutive quarters require recalibration - either the criticality classification is wrong, the reorder formulas need adjustment, or the supplier mix needs reconsideration.

90-day rollout plan

The realistic timeline for an 80 percent stockout reduction at a 200-employee plant:

Days 1-15: Audit and classify. Pull 24 months of MRO purchase data. Classify every SKU on ABC + VED. Identify the top 50 stockout events by cost in the last 12 months.

Days 16-30: Reorder point recalibration. Apply the peer-reviewed formula across all SKUs with the criticality-driven service-level target. Update the ERP or inventory system with new reorder points and safety stock levels.

Days 31-60: VMI on A-class. Negotiate VMI contracts with the supplier of choice for top 20 A-class vital SKUs. Service level 98 percent target, weekly audit, consignment ownership. Use the 12-clause VMI contract checklist.

Days 61-90: Vending on C-class. Install 2-4 vending units at high-traffic dispense points. Load top 200-500 C-class SKUs. Per-user authentication, quantity caps, automated reorder triggers. Connect to ERP for cost-center allocation.

Day 90 onward: Monitor and optimize. Stockout frequency typically drops 50-60 percent in the first 90 days, reaching 75-85 percent by month 6 once the data loop matures and reorder points recalibrate against real consumption.

For the broader ROI context including labor recovery and shrinkage recapture, see our companion piece on tool vending machine ROI calculation. The stockout reduction line item is one of four ROI components - the others (labor, shrinkage, safety) compound into the total business case.

Frequently asked questions

What is a stockout in MRO inventory? An MRO stockout is the absence of a required maintenance, repair, or operations item at the moment of need. Stockouts range from a missing 6-cent washer (low cost) to a missing $3,000 specialty motor (production-line down). The aggregate cost includes the expedite-freight premium, mechanic overtime, lost production OEE, and the cascade of secondary delays.

How much does an MRO stockout actually cost? The range is wide. The Siemens/Senseye True Cost of Downtime 2024 reports Fortune Global 500 losses of $1.4 trillion per year (11 percent of revenue). ABB's survey reports average unplanned downtime cost at $125,000 per hour. Automotive plants can reach $2.3 million per hour. For most mid-size manufacturers, $25,000-$60,000 per stockout-induced production hour is a defensible mid-range estimate.

What is the average MRO stockout rate in manufacturing? Without segmentation, plants report 4-12 stockout events per quarter as typical. The number is misleading because it does not distinguish low-cost stockouts (missing washer) from high-cost stockouts (missing motor). Service-level reporting by criticality class is the meaningful metric - target 99% on A-class vital, 95% on C-class desirable.

How do you calculate safety stock for critical spares? Safety Stock = Z × σ_DL, where Z is the service-level factor (Z=2.58 for 99.5%, Z=2.33 for 99%, Z=1.88 for 97%) and σ_DL is the standard deviation of demand during lead time. The peer-reviewed (Q,r) model right-sizes safety stock to actual lead-time variance rather than fixed time-based rules - producing 56.9% inventory reduction in the MDPI 2020 study without lowering service levels.

What's the difference between MRO stockout and shrinkage? A stockout is the absence of a needed item at the moment of need. Shrinkage is the disappearance of inventory between receiving and consumption - typically 3-8 percent of MRO value annually at sites without per-user tracking. Both raise stockout risk, but the mechanisms are different: stockout management is about replenishment logic; shrinkage management is about access control.

Does vendor-managed inventory really reduce stockouts? Yes. Peer-reviewed evidence: VMI plus consignment stock reduced total supply chain cost by 14.8% (ScienceDirect 2023). The mechanism: the supplier has direct visibility into consumption and incentive to keep inventory above the agreed service level. For A-class critical spares, VMI typically reaches 98-99% service level versus 85-92% under traditional PO-driven replenishment.

How long does it take to reduce stockouts by 80%? A 90-day playbook produces 50-60% reduction in the first 90 days, reaching 75-85% by month 6 once the data loop matures. Some sites take 12 months to reach 80% reduction, particularly those with limited ERP integration or complex multi-supplier MRO categories. The single biggest delay factor is data quality on consumption history.

What KPIs should I track to measure stockout reduction? Six metrics: service level (fill rate) by criticality class, stockout frequency events per month, mean time between stockouts (MTBS), inventory turn ratio, inventory dollars on-hand, and days payable outstanding under VMI. Monthly tracking with quarterly executive review. Service level by class is the single most important metric - aggregate fill rate hides A-class problems behind C-class success.


How Do PPE Vending Machines Work

8 min read

How Do PPE Vending Machines Work

How Do PPE Vending Machines Work A PPE vending machine looks like a candy machine and replaces something that has barely changed since the 1970s -...

Read More

3 min read

The Carousel Vending Machine: An Endless Rotation of Problems

Why you need the latest in automated inventory management solutions Our previous post discussed the coil vending machine and its many...

Read More

3 min read

Safe Storage for Your IT Supplies

Vending machines are not just for snacks and drinks anymore. Vending machines that dispense IT supplies are becoming increasingly popular in...

Read More